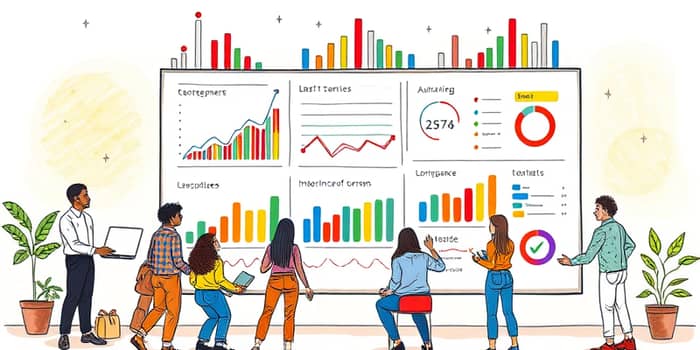
In a world overflowing with to-do lists, deadlines, and lofty ambitions, it’s easy to lose sight of how far you’ve come and what remains to be done. Harnessing the power of visual progress tracking can transform the way you perceive your goals and daily tasks. By transforming data into clear visuals, you gain a dynamic perspective on achievements and challenges alike. This article explores the magic of progress visualization, practical tools you can adopt today, and expert tips to sustain momentum over the long haul.
Whether you’re an individual striving for personal growth or a team leader steering a multi-member project, mapping your progress visually provides a compass for motivation, clarity, and accountability. Read on to discover the science, tools, and art behind effective visualization.
Visual progress tracking involves converting information about tasks, milestones, and performance metrics into graphical formats. These formats can include charts, graphs, dashboards, or even hand-drawn diagrams. Unlike raw data or text-only lists, visuals engage our brains more deeply, making it easier to process complex information at a glance.
By creating a visual representation, you instantly see where you stand in relation to your goals. This technique is equally valuable for:
Ultimately, visual progress tracking is about monitoring key metrics at a glance, helping you make informed decisions without drowning in spreadsheets.
Why invest time in creating charts and dashboards? The advantages go beyond aesthetics. Visual tools can unlock profound psychological and practical benefits:
Research consistently shows that visually tracking progress can improve productivity by up to 30%. Gamified elements—such as badges and milestone notifications—add an extra layer of engagement, particularly in workplace environments.
The right tool depends on your context, whether digital or analog. Below, a comparison highlights common options and their unique benefits:
Modern software often includes features like custom dashboards for every need, AI-driven recommendations, and seamless integration with analytics platforms. For those who prefer pen and paper, bullet journaling remains a beloved method for its tactile satisfaction and creative freedom.
Visualization tools shine in diverse settings. Consider these practical examples:
In each scenario, visuals facilitate quick assessments, foster alignment among stakeholders, and reduce the risk of costly misunderstandings.
Creating a chart is easy; maintaining it requires discipline and strategy. Follow these guidelines to ensure your visual progress tools deliver real value:
By embedding these practices into your routine, you create real-time feedback loops that guide progress and keep motivation high.
Even the most sophisticated visualization tools can falter if misused. Common pitfalls include:
Data Overload: Presenting too many metrics can paralyze decision-making.
Poor Design: Confusing color schemes or cluttered layouts undermine clarity.
Infrequent Updates: Outdated visuals lose credibility and fail to support informed actions.
To sidestep these issues, adhere to best practices:
Keep dashboards clean, prioritize your top three indicators, and schedule regular maintenance. Celebrate milestones visually—digital badges or a burst of color on a chart—to reinforce progress psychologically.
The future of progress visualization is bright, driven by emerging technologies:
AI Personalization: Tools analyze your history to suggest optimal visualization styles and highlight anomalies.
Predictive Analytics: Trend modeling forecasts potential roadblocks, allowing pre-emptive adjustments.
Integrated Ecosystems: Unified platforms will combine project management, performance dashboards, and communication channels in one interface, foster team collaboration and accountability like never before.
As these trends mature, your ability to leverage predictive analytics and AI will become a key differentiator in achieving sustained success.
Visual progress tracking is more than a productivity hack—it’s a mindset shift. By externalizing goals and performance metrics into engaging visuals, you gain instant clarity, maintain motivation, and foster accountability for yourself and your team.
Whether you choose digital dashboards, analog journals, or a hybrid approach, the essential step is to start. Select a tool that aligns with your needs, define meaningful metrics, and commit to regular updates. In time, you’ll experience the profound impact of seeing your journey unfold in vivid color, one milestone at a time.
References


