Search

In today’s fast-paced world, setting goals is just the first step. To truly bridge the gap between aspiration and achievement, individuals must be able to track their progress in a tangible way. Studies show that people who write down and regularly track their goals are 42% more likely to accomplish them. Yet, nearly 80% of resolutions fail by February. By harnessing the power of visual tools, we can transform abstract ambitions into clear, achievable milestones that inspire and guide us.
Visual tools go beyond mere checklists. They tap into our innate preference for images over text, making it easier to grasp complex information at a glance. Through intuitive charts, timelines, and progress bars, users can instantly assess how far they’ve come and what remains. This clarity not only boosts motivation but also fosters accountability, turning lofty dreams into a structured journey toward success.
Human brains process visual information 60,000 times faster than text. When we see a bar inching toward completion or a task card moving to the “Done” column, our reward centers light up, releasing dopamine. This chemical surge reinforces positive behavior, creating a feedback loop that makes us more likely to continue working toward our objectives.
Breaking goals into smaller, trackable components alleviates overwhelm. Rather than staring at a massive project with no clear direction, users can break down complex goals into actionable steps. This sense of immediate achievement fuels momentum, ensuring that each completed task becomes a celebratory milestone. Over time, these small wins accumulate, building confidence and reinforcing the habit of consistent progress.
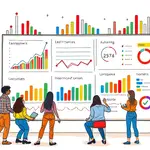
Several digital platforms have emerged to meet the growing demand for visual goal tracking. Each tool offers unique visualizations, from kanban boards to AI-driven charts. Below is a concise comparison of the top players in the space:
Whether you prefer drag-and-drop kanban boards, interactive timelines, or AI-generated trend charts, there is a solution tailored to your workflow. Many of these platforms also support collaboration, allowing teams to update charts in real-time and maintain alignment on shared objectives.
Visual features commonly include progress bars that show a percentage complete, bar and line graphs that highlight trends over time, and calendars or Gantt charts that map out tasks against deadlines. Automated reminders and status updates further reduce the need for manual oversight, ensuring that progress is consistently logged and reflected.
Adopting visual goal-tracking tools is just the beginning. To maximize their impact, follow these practical guidelines:
By implementing these strategies, you’ll turn passive tracking into an active, ongoing practice that keeps you engaged and motivated. Remember, it’s not just the tool but how you use it that drives results.
The landscape of goal-setting software continues to evolve, driven by advances in technology and user experience design. Key trends include:
Gamification elements—such as badges, leaderboards, and reward systems—are making progress tracking more playful and engaging. By tapping into our competitive instincts, users feel energized to reach new levels of achievement.
AI-driven insights are another game-changer. Platforms analyze your progress patterns and offer personalized, visual recommendations for optimizing workflows and improving success rates. These intelligent dashboards can highlight areas of risk before they derail your timeline.
Real-time collaboration tools are also gaining traction, enabling geographically dispersed teams to update and visualize progress synchronously. This fosters transparency and collective accountability, two critical factors in achieving shared objectives.
Visual tools empower us to transform abstract intentions into concrete, trackable actions. By harnessing the latest software solutions, embracing best practices, and staying attuned to emerging trends, you can significantly improve your odds of success. Whether you’re pursuing personal milestones, leading a startup, or driving organizational objectives, the right visual dashboard will serve as your compass, guiding you every step of the way.
As you embark on your next goal-setting journey, remember that each visible milestone, each filled progress bar, and each moved task card represents more than just data—it symbolizes growth, dedication, and the fulfillment of your potential. Start visualizing, keep tracking, and watch your ambitions come to life.
References